
SARINA Capital fund was up 1.4% for the month of August 2018 compared to gains of 3.0% and 4.2% for S&P 500 and the Russell 2000 index, respectively. On a year-to-date basis, SARINA Capital is up 14.3% compared to 8.5% and 13.4% for S&P 500 and Russell 2000 index. The last quarter of the year could be crucial as there may be some major swings in the market driven by factors such as trade wars, political risk (November mid-term elections), and the possibility of global economic slowdown.
US Equities Vs. World
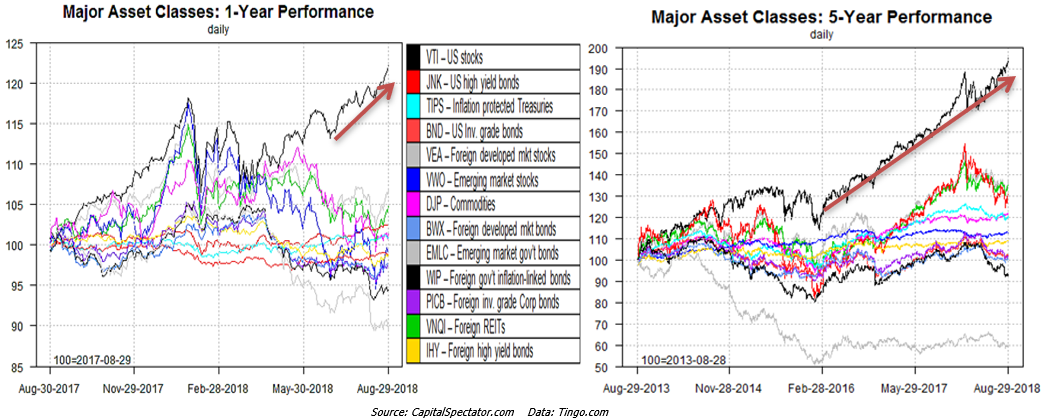
If you’ve been paying attention to the business headlines, you keep hearing “Markets hit a new high today.” Though this year has been more volatile than the past couple of years, the higher risk seems to be paying off for those with exposure to the US stocks. The US stocks have outperformed international markets and other major asset classes by a wide margin over the last year and even the last 5 years. A $100 invested in VTI (US stocks ETF) a year ago would be worth more than $122 as of August month-end and the next best performer over the same period is VEA (Vanguard FTSE Developed markets ETF) at a distant $106.


After such an amazing run, the question most investors are asking is whether it is time to pull out of US equities. That concern is absolutely valid because it is difficult to ignore the outsized returns generated by US stocks and a prudent approach would be to take some gains off the table.
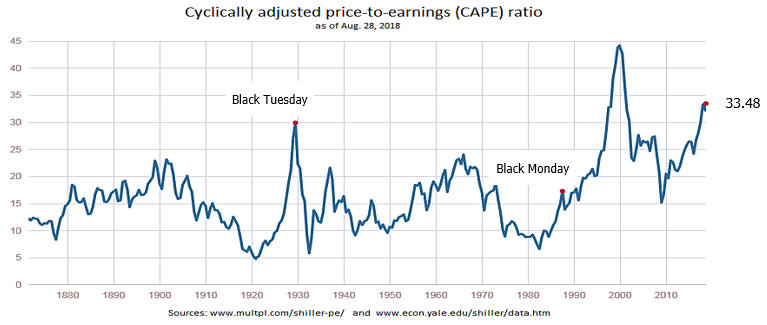
However, beyond the outperformance one must evaluate other factors that could provide a better barometer for valuation. We have discussed price to equity (PE) metric in our previous newsletters to understand valuation and an extension of the PE ratio is the cyclically adjusted price to earnings (CAPE) ratio. This ratio was developed by Yale University professor Robert Schiller as a way to adjust for cyclicality of earnings and business cycles. This ratio is typically applied to broader market indices to determine if the market is under or over-valued. The ratio smooths earnings for S&P 500 by taking an average of real earnings over the past 10 years. Professor Schiller and John Campbell first introduced this ration in 1996 to the Federal Reserve to argue that stock prices had gone up at a much faster pace than they should (you may recall Chairman Alan Greenspan’s famous comment around the market’s “irrational exuberance” in December 1996). The CAPE ratio is currently at 33.5 and the only other time it has crossed 30 was in 1929 and 2000. The chart below presents a historical view of the CAPE ratio:


The long-term average of CAPE ratio is approximately 17. Back in 1997, Schiller and Campbell argued that ratio was predicting that the real value of the market would 40% lower in ten years than it was at that time. Of course we all know about the tech bubble that busted in 2000 and the 2008 crash that sent the S&P 500 plunging down 60% from October 2007 to March 2009. Though the CAPE ratio is high relative to its historical average, we must also keep in mind that growth in the US is currently very strong (2Q18 GDP growth was raised to 4.2%, strongest gain in 4 years) and earnings estimates and results continue to produce positive surprises for the most part.
In summary, what we are saying that we can’t predict when this bull run will end and as a matter of fact, you should run as far away as possible from those who tell you that they can predict the markets! That said, all good things must come to end and so will this bull run and if you are happy with your gains from US equities, perhaps it might be a time to think about rebalancing your portfolios with other asset classes.
Consumer Discretionary Vs. Consumer Staples
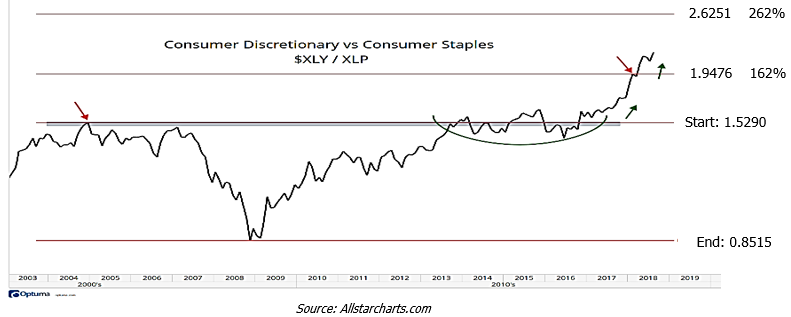
One of the investment theme that has come out during this bull run has been investment in Consumer Discretionary (defined as consumer goods that are non-essential) relative to Consumer Staples (defined as basic/necessary consumer goods). The interesting thing about this metric is that it peaked well before the S&P started its historic collapse in late 2007 and it bottomed a quarter before the S&P 500’s low point, so economist and others believe this could a leading indicator for future market performance.


The idea is quiet simple here – in an economy that is on the upswing, investors bet that consumers will spend more on discretionary goods. The reverse is also true – investors will shift to consumer staples once the economy starts to turn the other way. The ratio of investments in Consumer Discretionary versus Consumer Staples is currently high relative to its recent history and perhaps this is also another indicator that tells us that we should exercise caution.
We must understand that the economy operates in a cycle and this cycle will also come to an end. Therefore, we recommend investors to exercise prudency by rebalancing portfolios, taking gains where appropriate, and/or shifting to asset classes that do well during downturns (i.e. Consumer Staples).
Happy investing!
Disclosure Statements:
- This letter is confidential and may not be redistributed without the express written consent of SARINA Capital, LP.
- The information presented does not involve the rendering of personalized investment, financial, legal or tax advice, but is limited to the dissemination of general information on products and services. Before implementing any of the options presented, a professional adviser should be consulted about the legal, tax and financial suitability of this type of investment. This presentation should not be viewed as an offer to buy or sell, or a solicitation of any offer to buy or sell the securities mentioned herein.
- Past performance is no guarantee of future results. No person should invest who is not, either alone or with their advisers, capable of evaluating the merits and risks of prospective investments. No representation is made that SARINA Capital, LP will or is likely to achieve its investment objectives or that any investor will or is likely to achieve results comparable to those shown or will make any profit at all or will be able to avoid incurring substantial losses.
- Specific companies or securities mentioned in this document are meant to demonstrate SARINA Capital’s investment style and the types of industries and instruments in which we invest and are not selected based on past performance. The analyses and conclusions of SARINA Capital contained in this document include certain statements, assumptions, estimates and projections that reflect various assumptions by SARINA Capital concerning anticipated results that are inherently subject to significant economic, competitive, and other uncertainties and contingencies and have been included solely for illustrative purposes. No representations express or implied, are made as to the accuracy or completeness of such statements, assumptions, estimates or projections or with respect to any other materials herein. SARINA Capital may buy, sell, cover or otherwise change the nature, form or amount of its investments, including any investments identified in this letter, without further notice and in SARINA Capital’s sole discretion and for any reason. SARINA Capital hereby disclaims any duty to update any information in this letter.
- Information presented is believed to be factual and up-to-date, but we do not guarantee its accuracy and it should not be regarded as a complete analysis of the subjects discussed. All expressions of opinion reflect the judgment of the authors as of the date of preparation and are subject to change.
- Certain information has been provided by third-party sources and, although believed to be reliable, it has not been independently verified and its accuracy or completeness cannot be guaranteed.
- © 2020 SARINA Associates, LLC, all rights reserved.


