
October lived it up to expectation of being a scarry month! Concerns related to a second COVID-19 wave materialized in Europe and U.S. resulting in major European countries imposing a second (albeit lighter) lockdown. Additionally, concerns about U.S. election results and post-election result turmoil drove fears into the hearts of investors. Lastly, calls about markets being overvalued and another crash on the horizon got louder as we saw significantly higher number of articles on that topic. Despite all this noise in October, the markets are off to an extremely hot start in the month of November as fears of a blue wave (i.e. Democratic sweep of both the Presidential election as well gaining Senate majority) appear highly unlikely. The Presidential election appears to be titling in favor of Democratic party and with the majority in the House, we do expect the Democrats to bring about significant changes; however, their hands will be tied if the Senate majority is not gained. Given the possibility of a Biden/Harris victory, markets are retreating a bit as expectations of continued favorable business laws and less regulations are seen fading away.
Markets Overvalued?
Many pundits have started to sound alarm bells about markets being overvalued. When looking at some key metrics relative to their historic levels, it is easy to see why many investors and experts believe we could be close to the market peak.


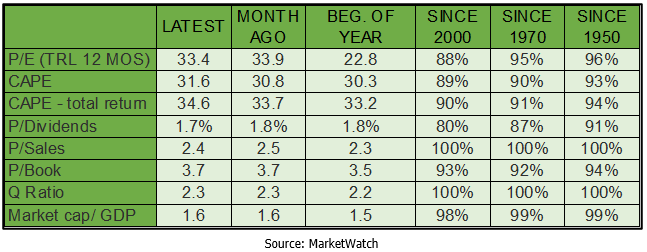
The data above, presented by Mark Hulbert, highlights eight key measures and shows latest data (as of October), month ago data, beginning of the year data and provides a percentile rank for the latest data point relative to 20, 50 and 70 years. Most of the ratios noted above are self-explanatory and the only one that is not commonly known is the “Q ratio.” This ratio is calculated by dividing the total market cap of publicly traded U.S. companies by the replacement cost of corporate assets. The last indicator, market cap to GDP, is based on the initial estimate of third-quarter GDP, which was just released on October 29th.
As seen in the table above, the percentile rank of current data relative 20-, 50-, and 70-years of historical data is above 90% (with the exception of 4 data points). The three indicators that concern us the most are price to equity for the trailing 12 months, price to sales, and market cap to GDP. The price to equity ratio is for the S&P 500 and using trailing earnings per share number provides a consistent approach rather than forward looking price to earnings ratio given the inconsistencies in the availability of analyst estimates. The historical average of the S&P 500 PE ratio is approximately 16, so the current ratio of 33.4 is indeed outrageously high. At the end of the day, companies must earn the price investors are willing to pay for their stock and if that does not happen over time, a correction in the stock price occurs. Growth companies are an exception to this rule as future growth expectations drive the current price of the stock higher. Many technology companies are in this boat right now with outrageous price to sales (to the tune of 100+), but investors are willing to pay the price now because of exponential growth many technology companies are seeing. Looking at the historical rank of the price to sales ratio, we are currently in the 100th percentile rank for S&P 500 companies, meaning this is the highest recording for this ratio! Yes, we agree times are different; however, overpaying for the top line number relative to historical levels is also not a good idea in our opinion.
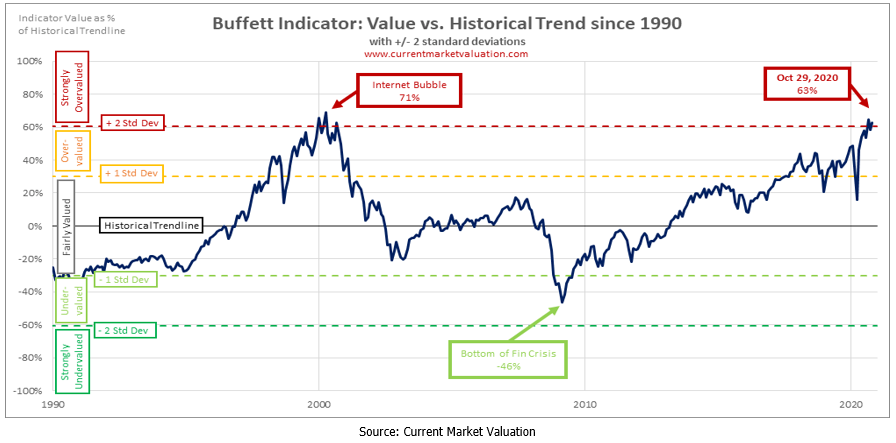
The last indicator that we would like to focus on is the market cap to GDP. The ratio is important as the stock market represents expectations of future economic activity, which is represented by GDP. Therefore, this ratio is a good indicator of expected future growth relative to current performance. This ratio typically should stable and move ahead slowly as technological innovation brings about operational efficiencies. However, we have seen this ratio skyrocket to 63%, which is the highest level since the internet bubble (71%).


Recall, back in the late 1990s during the internet bubble, value investors were mocked for their style of investing as growth stocks far outpaced value stocks in the period. Of course, the value investors ended up having the last laugh as things turned south in 2001 and a recession ensued.
One last point we would like to make is about timing. When investing it is important to understand the time horizon of the investment. The indicators we have presented above are more relevant for long-term prospects of the markets. If the time horizon is near-term, there are not many (if any) statistically significant indicators that can be good predictors of market returns.
In summary, we do agree with many of the experts who are sounding alarm bells about markets being overvalued and our approach to investing is taking a balanced view. We are invested in stocks with a strong balance sheet that will survive over the long-term while also gaining exposure to bond and gold, both of which tend to perform well during downturns. We are firm believers of “slow and steady wins the race” rather than sprinting to the finish line.
Happy investing!
Disclosure Statements:
- This letter is confidential and may not be redistributed without the express written consent of SARINA Capital, LP.
- The information presented does not involve the rendering of personalized investment, financial, legal or tax advice, but is limited to the dissemination of general information on products and services. Before implementing any of the options presented, a professional adviser should be consulted about the legal, tax and financial suitability of this type of investment. This presentation should not be viewed as an offer to buy or sell, or a solicitation of any offer to buy or sell the securities mentioned herein.
- Past performance is no guarantee of future results. No person should invest who is not, either alone or with their advisers, capable of evaluating the merits and risks of prospective investments. No representation is made that SARINA Capital, LP will or is likely to achieve its investment objectives or that any investor will or is likely to achieve results comparable to those shown or will make any profit at all or will be able to avoid incurring substantial losses.
- Specific companies or securities mentioned in this document are meant to demonstrate SARINA Capital’s investment style and the types of industries and instruments in which we invest and are not selected based on past performance. The analyses and conclusions of SARINA Capital contained in this document include certain statements, assumptions, estimates and projections that reflect various assumptions by SARINA Capital concerning anticipated results that are inherently subject to significant economic, competitive, and other uncertainties and contingencies and have been included solely for illustrative purposes. No representations express or implied, are made as to the accuracy or completeness of such statements, assumptions, estimates or projections or with respect to any other materials herein. SARINA Capital may buy, sell, cover or otherwise change the nature, form or amount of its investments, including any investments identified in this letter, without further notice and in SARINA Capital’s sole discretion and for any reason. SARINA Capital hereby disclaims any duty to update any information in this letter.
- Information presented is believed to be factual and up-to-date, but we do not guarantee its accuracy and it should not be regarded as a complete analysis of the subjects discussed. All expressions of opinion reflect the judgment of the authors as of the date of preparation and are subject to change.
- Certain information has been provided by third-party sources and, although believed to be reliable, it has not been independently verified and its accuracy or completeness cannot be guaranteed.
- © 2020 SARINA Associates, LLC, all rights reserved.


